

Last week marked the launch of the 2025 Kentucky KIDS COUNT Data Dashboard by Kentucky Youth Advocates (KYA). KYA has been releasing the Kentucky KIDS COUNT report to measure child well-being in Kentucky annually for 35 years. The Data Dashboard allows users to see how data for regions and neighboring counties has improved, worsened, or stayed the same over time with interactive heat maps. Individual county profiles are also available for viewing and downloading. KOHC members and advocates can help connect the dots among data, healthy communities, and improved oral health for all Kentuckians by sharing information from the KIDS COUNT Data Dashboard with partners and decision-makers.
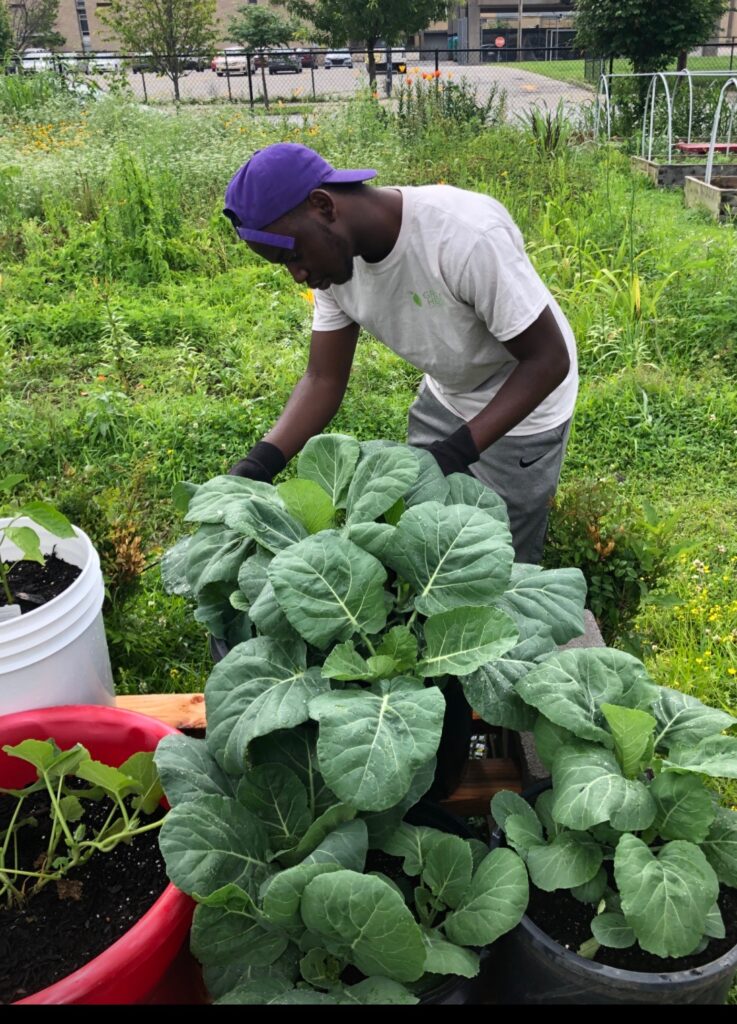
Since nutrition and oral health have a bidirectional relationship, oral health professionals and advocates may be particularly interested in the highlighted data on food insecurity and childhood obesity. At last week’s press conference, Karena Cash, Data and Research Director for KYA, explained how areas with the highest levels of food insecurity also have the highest levels of childhood obesity: “Often, when we think about food insecurity and hunger, we picture extreme forms of malnutrition, which just isn’t the reality, often, of what food insecurity looks like here in Kentucky” said Cash. “Food insecurity in Kentucky can be very hidden and a lot trickier to identify, because it’s often things like parents skipping meals to ensure that their kids have enough food at dinner, or families choosing between, ‘do I pay my utility bills this month, or do I buy groceries?’ Or –which is the connection to obesity — having to rely on cheap, ultra processed foods in order to make ends meet when it comes to their food budget.” She also noted that access to grocery stores is another factor affecting nutrition options for families: “The neighborhood a child grows up in, and, specifically, the proximity to a grocery store within their neighborhood, can strongly influence their access to healthy foods.”
In Kentucky, while the child poverty rate has improved in 111 of 120 counties in the past 5 years, one in five (20%) children overall continue to live in poverty. There were five counties – all in eastern Kentucky – with child poverty rates of over 40%. Due to historic and ongoing barriers to opportunities, 31% of Black children and 23% of Latinx children live in poverty in Kentucky compared to 17% of White children.
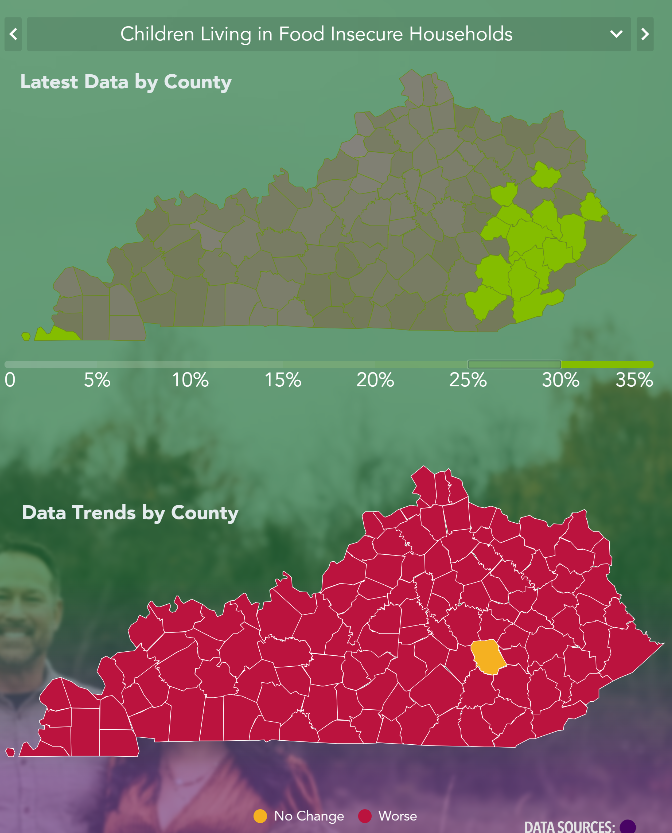
Despite improvements in poverty rates, the latest data show more than 1 in 4 food-insecure families earn too much to qualify for free/reduced meals at school. All but one Kentucky county experienced worse rates of child food insecurity; Fulton County in western Kentucky along with 14 counties in eastern Kentucky had food insecurity rates over 30%.
KYA recommends placing Kynectors in schools to help eligible families successfully enroll in SNAP and Medicaid. This could allow more children in Kentucky schools to receive free meals through the Community Eligibility Provision (CEP). Students who received free or reduced-price meals had at least a 29% drop in poor health and at least a 17% drop in obesity. Other recommendations include initiatives that increase access to nutritious foods and stretch the value of SNAP and WIC benefits while supporting Kentucky farmers, like Double Dollars and the WIC Farmers Market Nutrition Program.
KOHC members and advocates may also want to view state and county level health data, which includes how many children had health insurance. These numbers increased to 96.5% overall for the state, with the lowest county percentage being 93.5% (2023 data). Yet data released from the 2023 KOHC landscape assessment showed fewer than half of Kentucky children on Medicaid or KCHIP received a routine dental visit (2019 data).
A recording of last week’s webinar to learn more about how to access and use the KIDS COUNT data is available here.


